Post-party Mobility Challenges in NYC
INTERACTIVE WEBSITE
Navigating New York City at night can be challenging, especially for young residents. The limited frequency and routes of the subway during late hours make it a less practical option for those heading home after dark. Taxis often become the necessary choice for safe, direct travel. This dashboard analyzes night taxi ridership to pinpoint regions with the highest demand, highlighting areas that should be prioritized for new, affordable mobility solutions. By comparing the time differences between taxi use and the late-night subway service, it identifies opportunities to enhance nighttime safety and accessibility for young city dwellers.
Data Visualization
Hao Che Hung, Data Visualization Design,
Hao Lun Hung, Web Development, Data Visualization Development

Flood Adovcay Mapping Tool
INTERACTIVE WEBSITE
FloodGen is a flood advocacy tool that uses generative AI to visualize photorealistic images of potential flood scenarios. Positioned as an advocacy tool that reaches beyond the limits of traditional aerial maps, FloodGen is designed to raise awareness, support community preparedness, and support local government’s resilience strategies.
Data Visualization
Ashley Louie, Director, Data Visualization Design,
Hao Lun Hung, Web Development, Data Visualization Design
Erik Brown, Data Analysis
Hailee Hoa Luong, User Interface Design
NY State Right to Counsel Map for HCMC Support
INTERACTIVE WEBSITE
Housing Courts Must Change! (HCMC) is a statewide campaign launched by the Right to Counsel NYC Coalition in 2020 to transform the courts across New York State (NYS) from an “eviction machine” to a place that holds landlords accountable, upholds tenants’ rights, and enables tenants to remain in their homes.
NYS legislative support for the HCMC campaign platform is shown on the map through Senate and Assembly districts. The HCMC campaign focuses on our legislative demands
Data Visualization
Ashley Louie, Director, Data Visualization Design,
Hao Lun Hung, Web Development, Data Visualization Design
Erik Brown, Data Analysis
Hailee Hoa Luong, User Interface Design
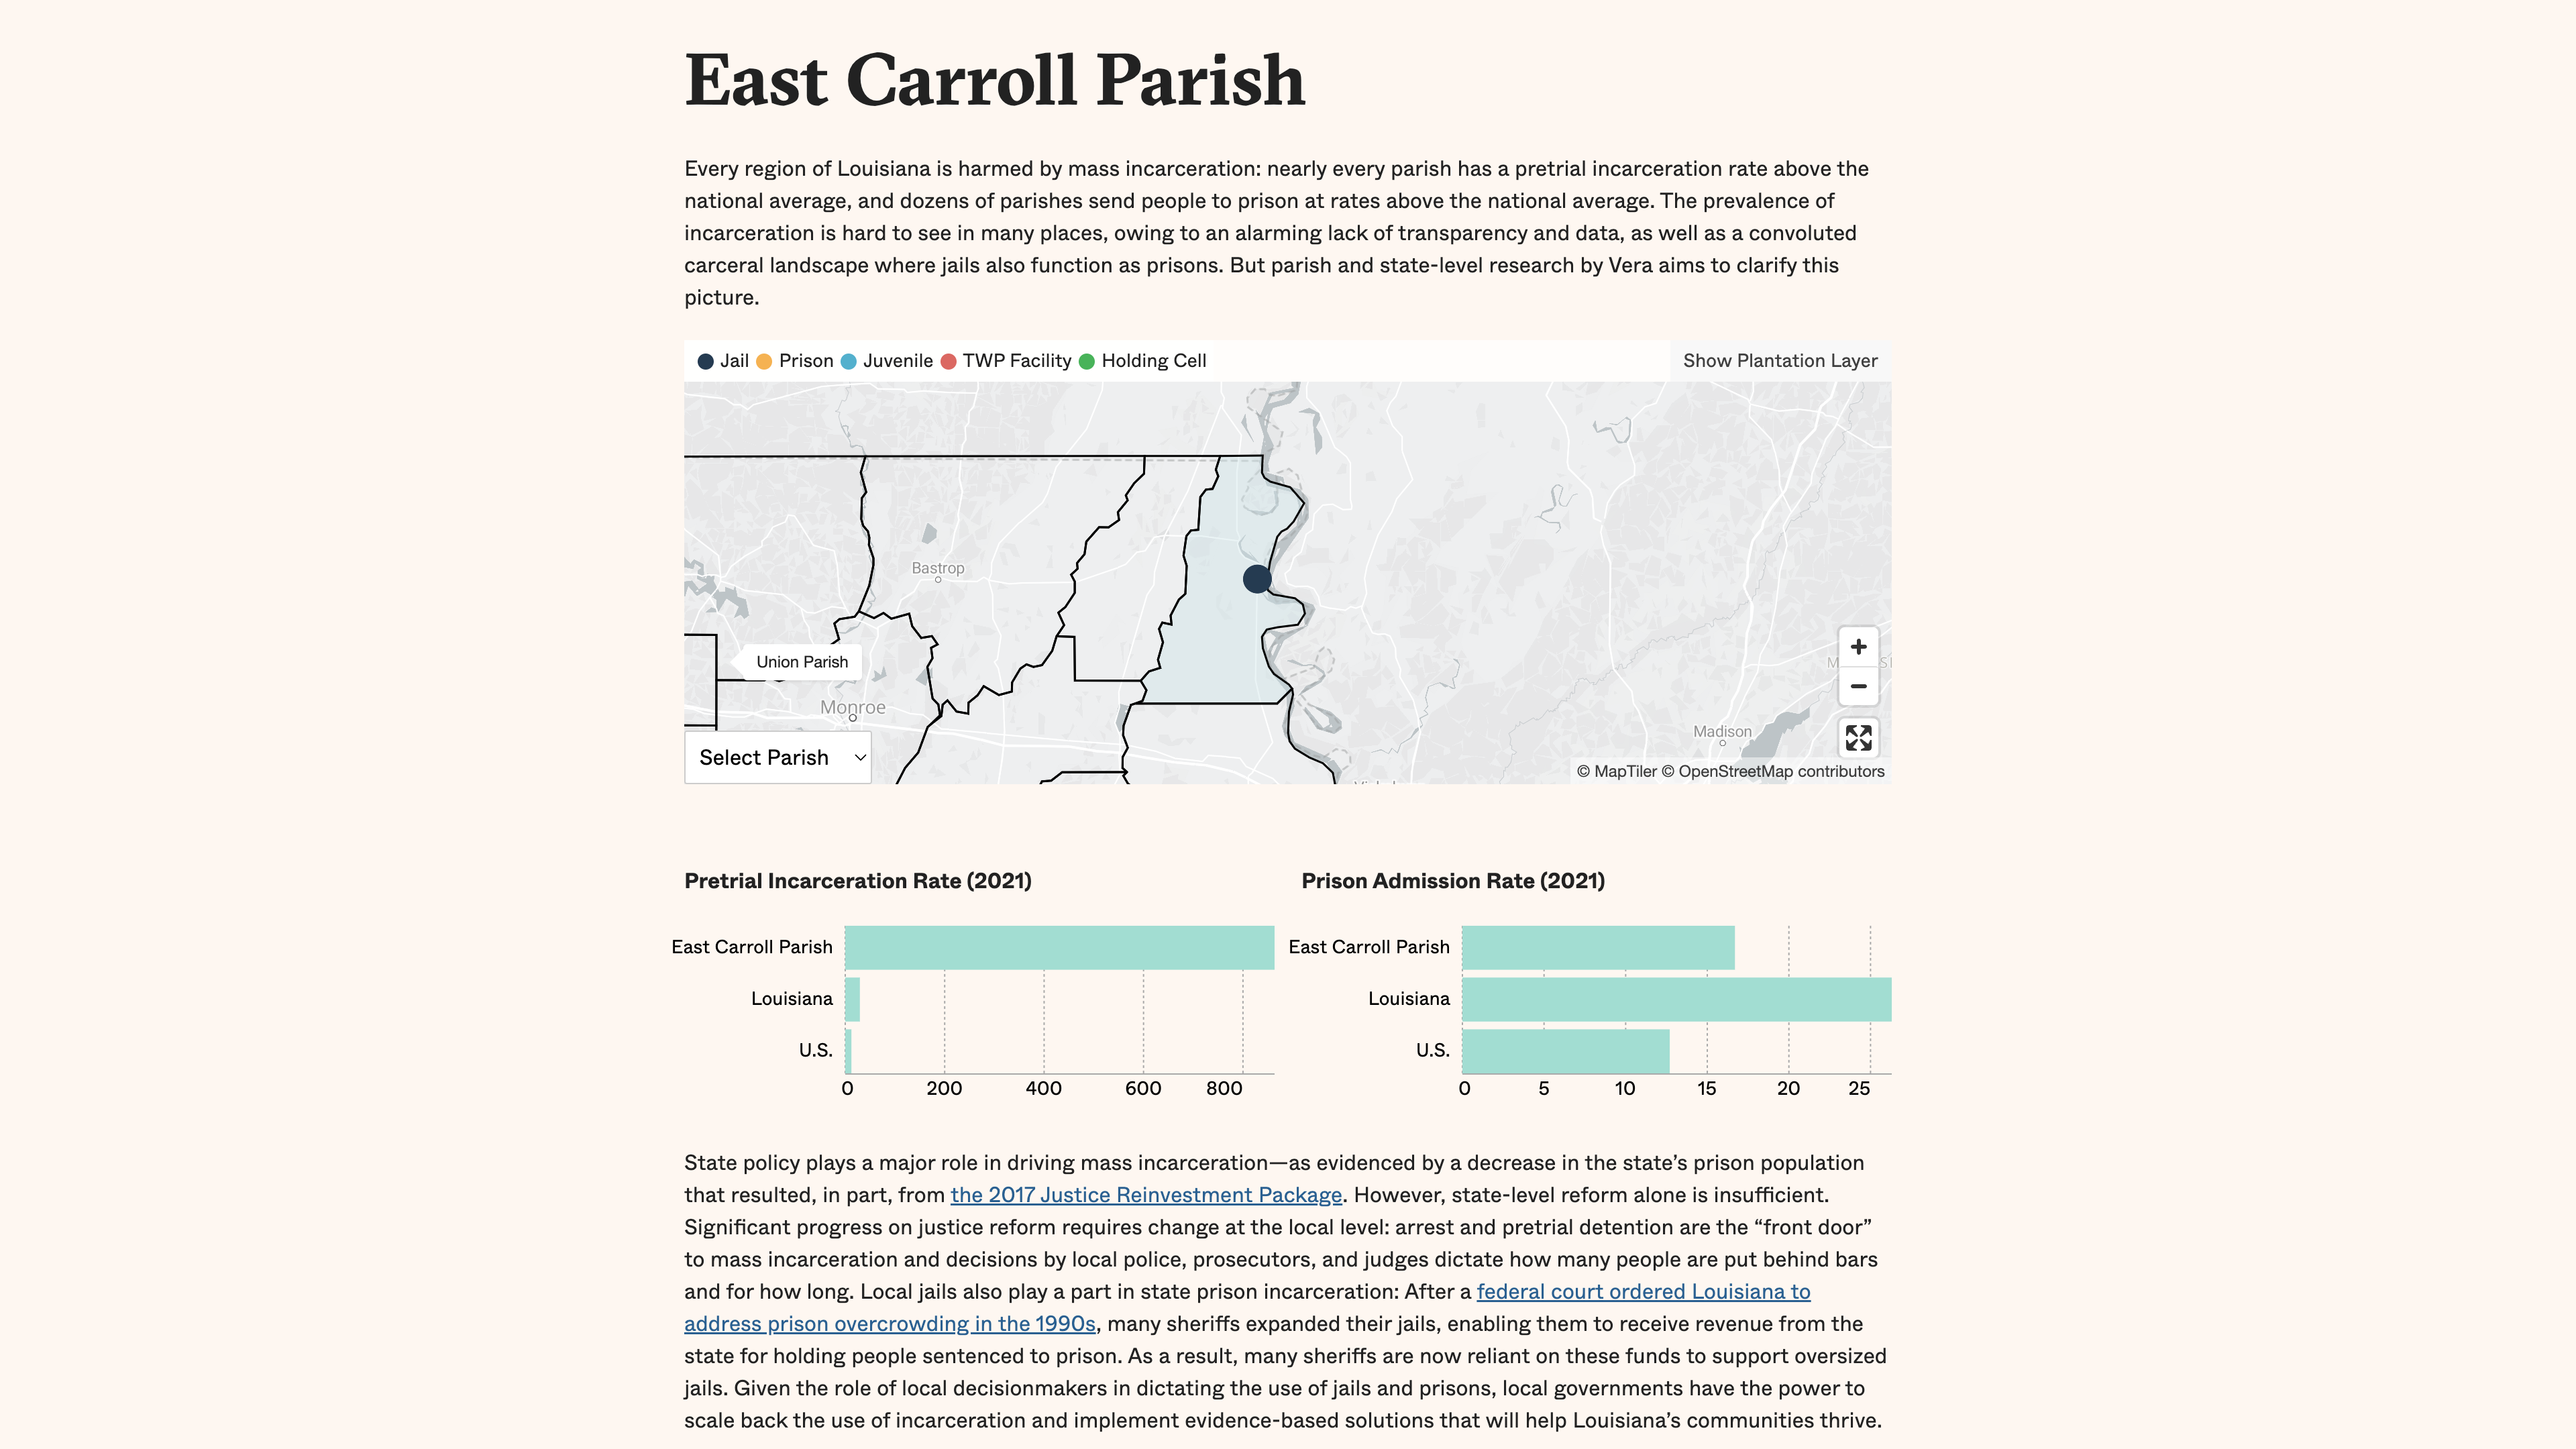
A Problem in Every Parish
INTERACTIVE WEBSITE
Louisiana’s 64 parishes range from bustling cities to vast rural stretches, from the parks and preserves of the north to the swamps and marshes of the gulf. Yet, they all share one defining characteristic: a stake in the state’s vast network of jails, prisons, and juvenile detention facilities.
The prevalence of incarceration in Louisiana is hard to see in many places due to an alarming lack of transparency and data, as well as a convoluted carceral landscape where local jails also function as prisons. But parish- and state-level research by the Vera Institute of Justice brings much-needed clarity to this picture. Vera’s datahub provides illuminating access to parish-level data on arrests, pretrial detention, incarceration, and local spending on the criminal legal system. Together, these data points create a detailed—and highly damning—picture of mass incarceration in Louisiana.
Data Visualization
Jill Hubley, Visualization Design, Visualization Development
Hao Lun Hung, Visualization Design, Visualization Development
Christian Henrichson, Data Analysis, Writing
Sara Lanclos, Data Analysis
Selina Ho, Data Analysis
Sam Raim, Writing
Will Snowden, Writing
Kim Mosby, Writing
Léon Digard, Editing

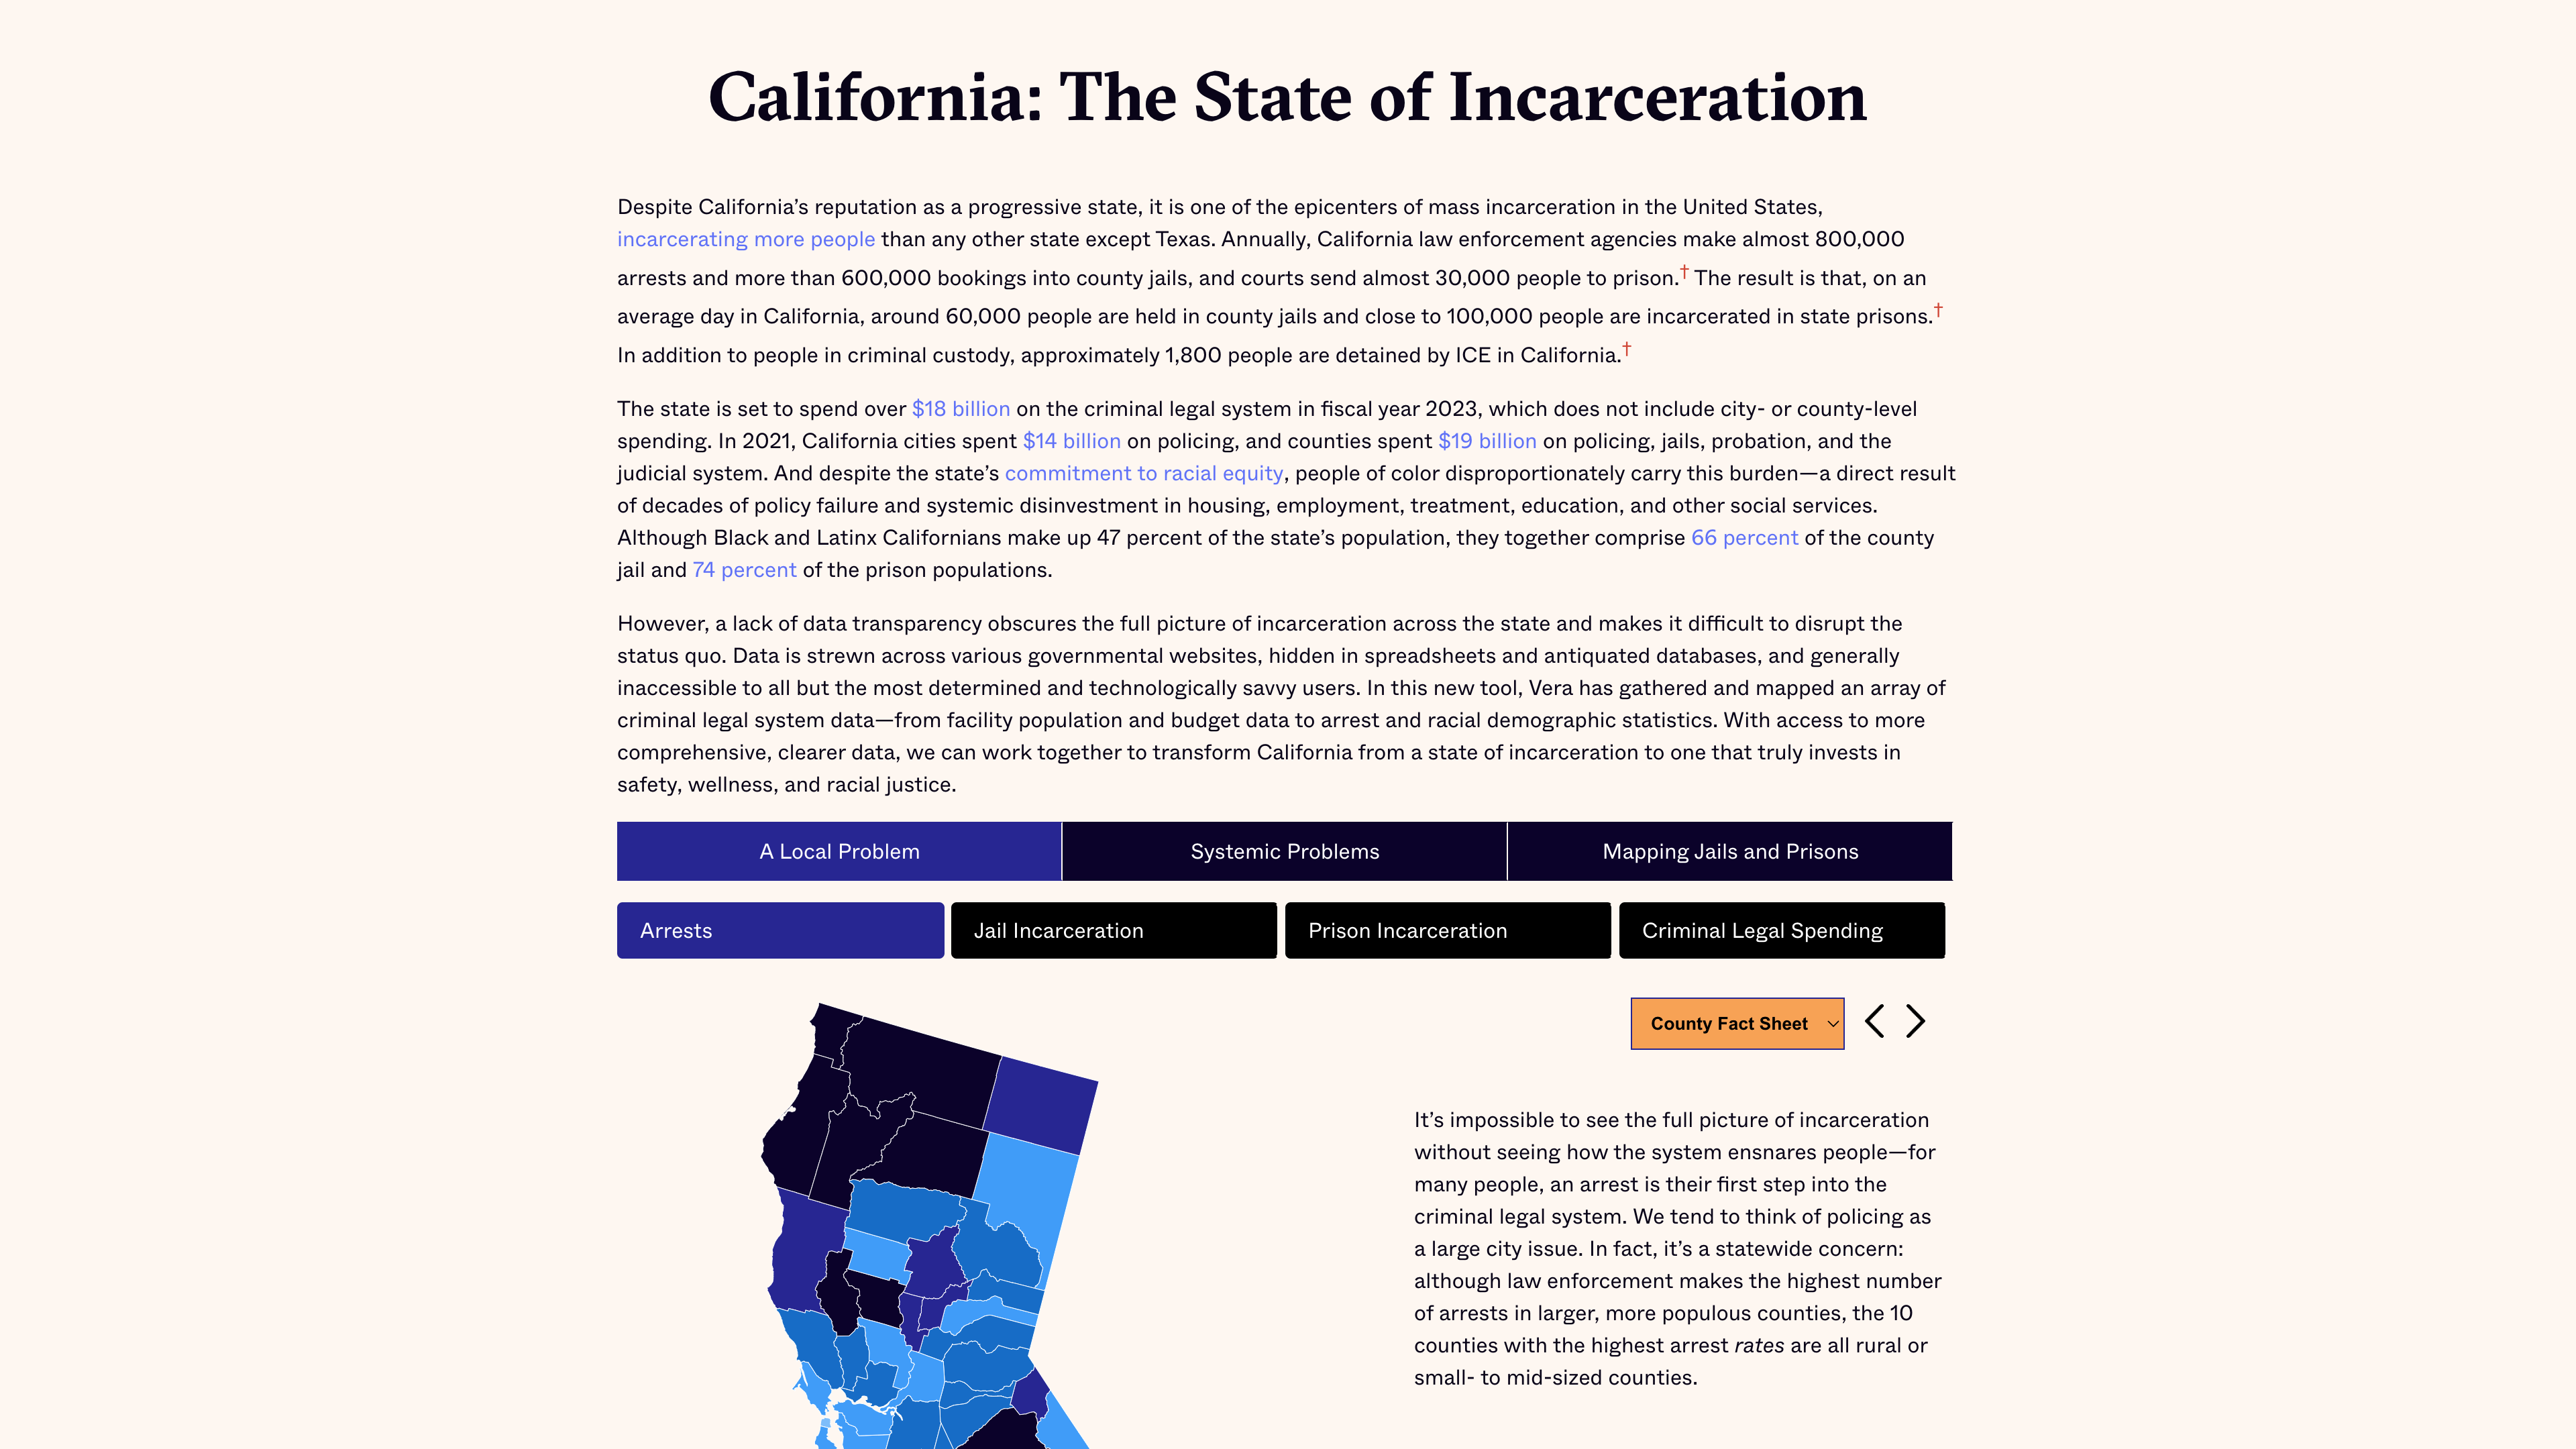
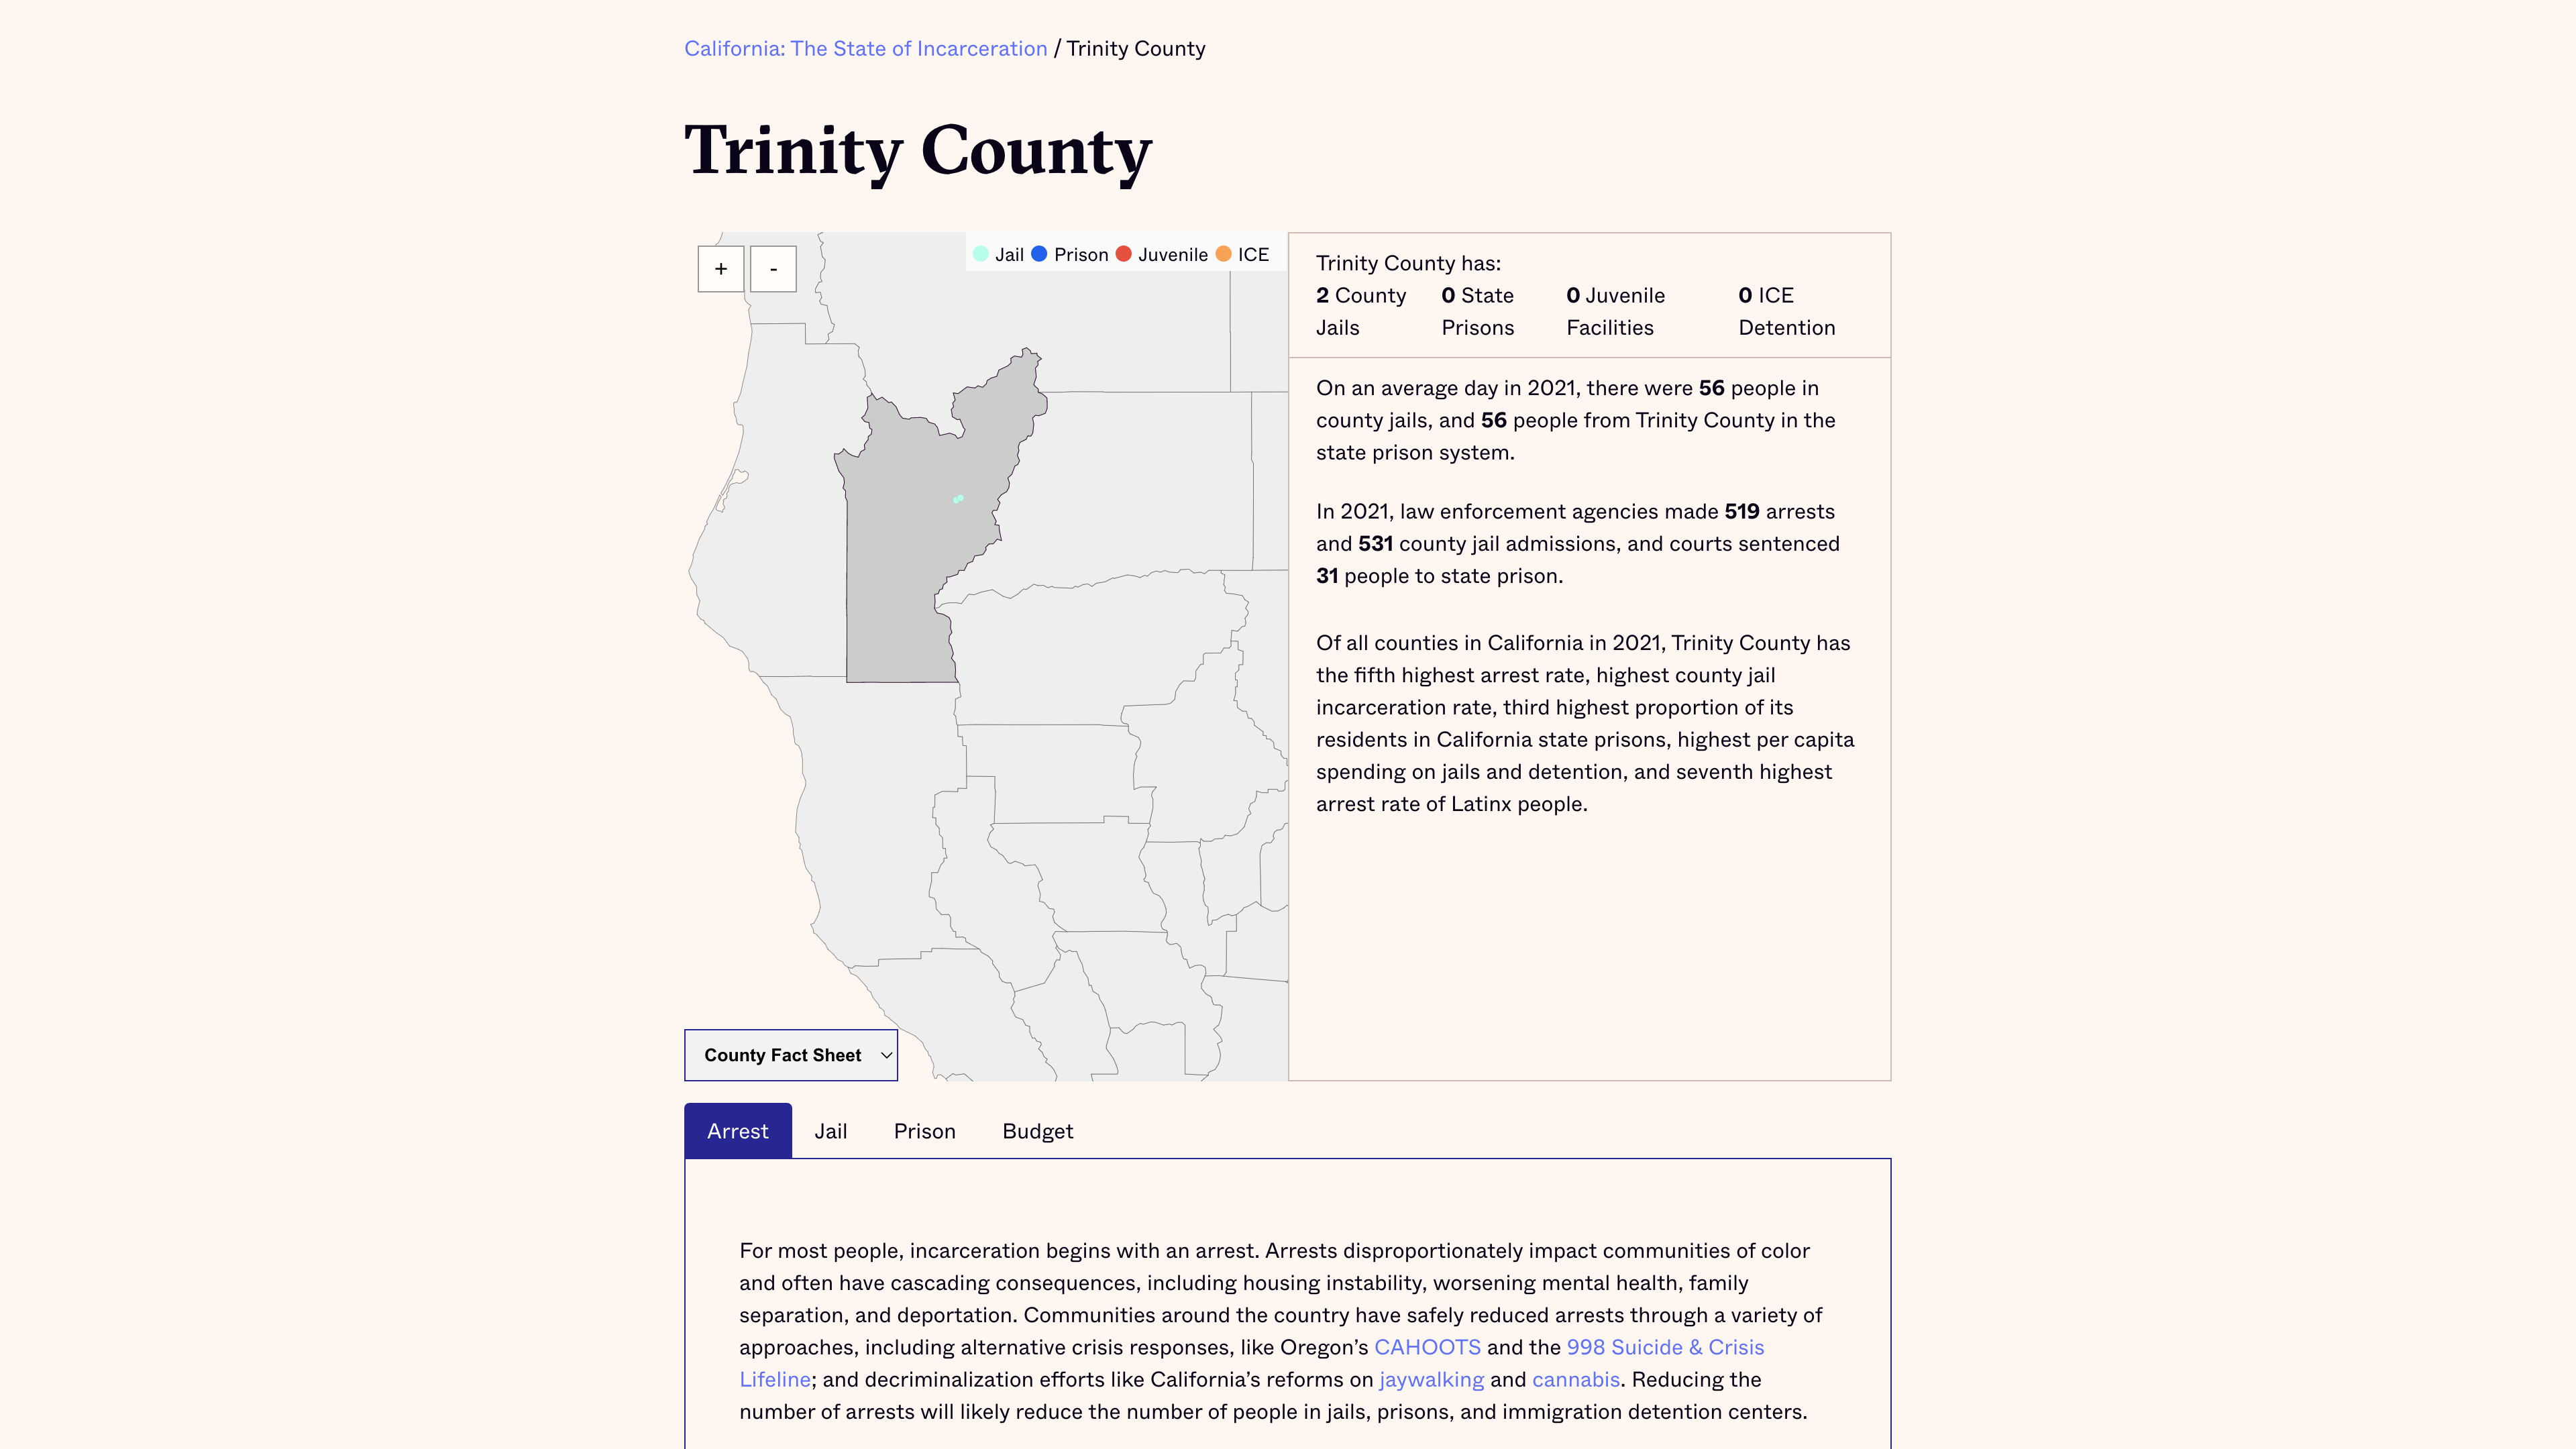
A Problem in Every Parish
INTERACTIVE WEBSITE
The project was designed to visualize the picture of incarceration trends in California. The perpectives include jail and prison, women, and racial disparities. Also, users can deep down to counties levels to look through the circumstances of local incarceration. Through exploring how incarcerationvaries across California with different angles, users are able to examine how the jails have been used over time.
Data Visualization
Jill Hubley, Visualization Design, Visualization Development
Hao Lun Hung, Visualization Design, Visualization Development
Christian Henrichson, Data Analysis
Sara Lanclos, Data Analysis
Selina Ho, Data Analysis
Christopher Kaiser-Nyman, Data Analysis, Writing
Brandon Sixto, Data Analysis, Writing
Michelle Parris, Writing
Sam Raim, Editing
Léon Digard, Editing