Data Station Competition
Analytics of shipping area trend and target audience visualization tool
INTERACTIVE WEBSITE
Analytics of shipping area trend and target audience visualization tool
INTERACTIVE WEBSITE
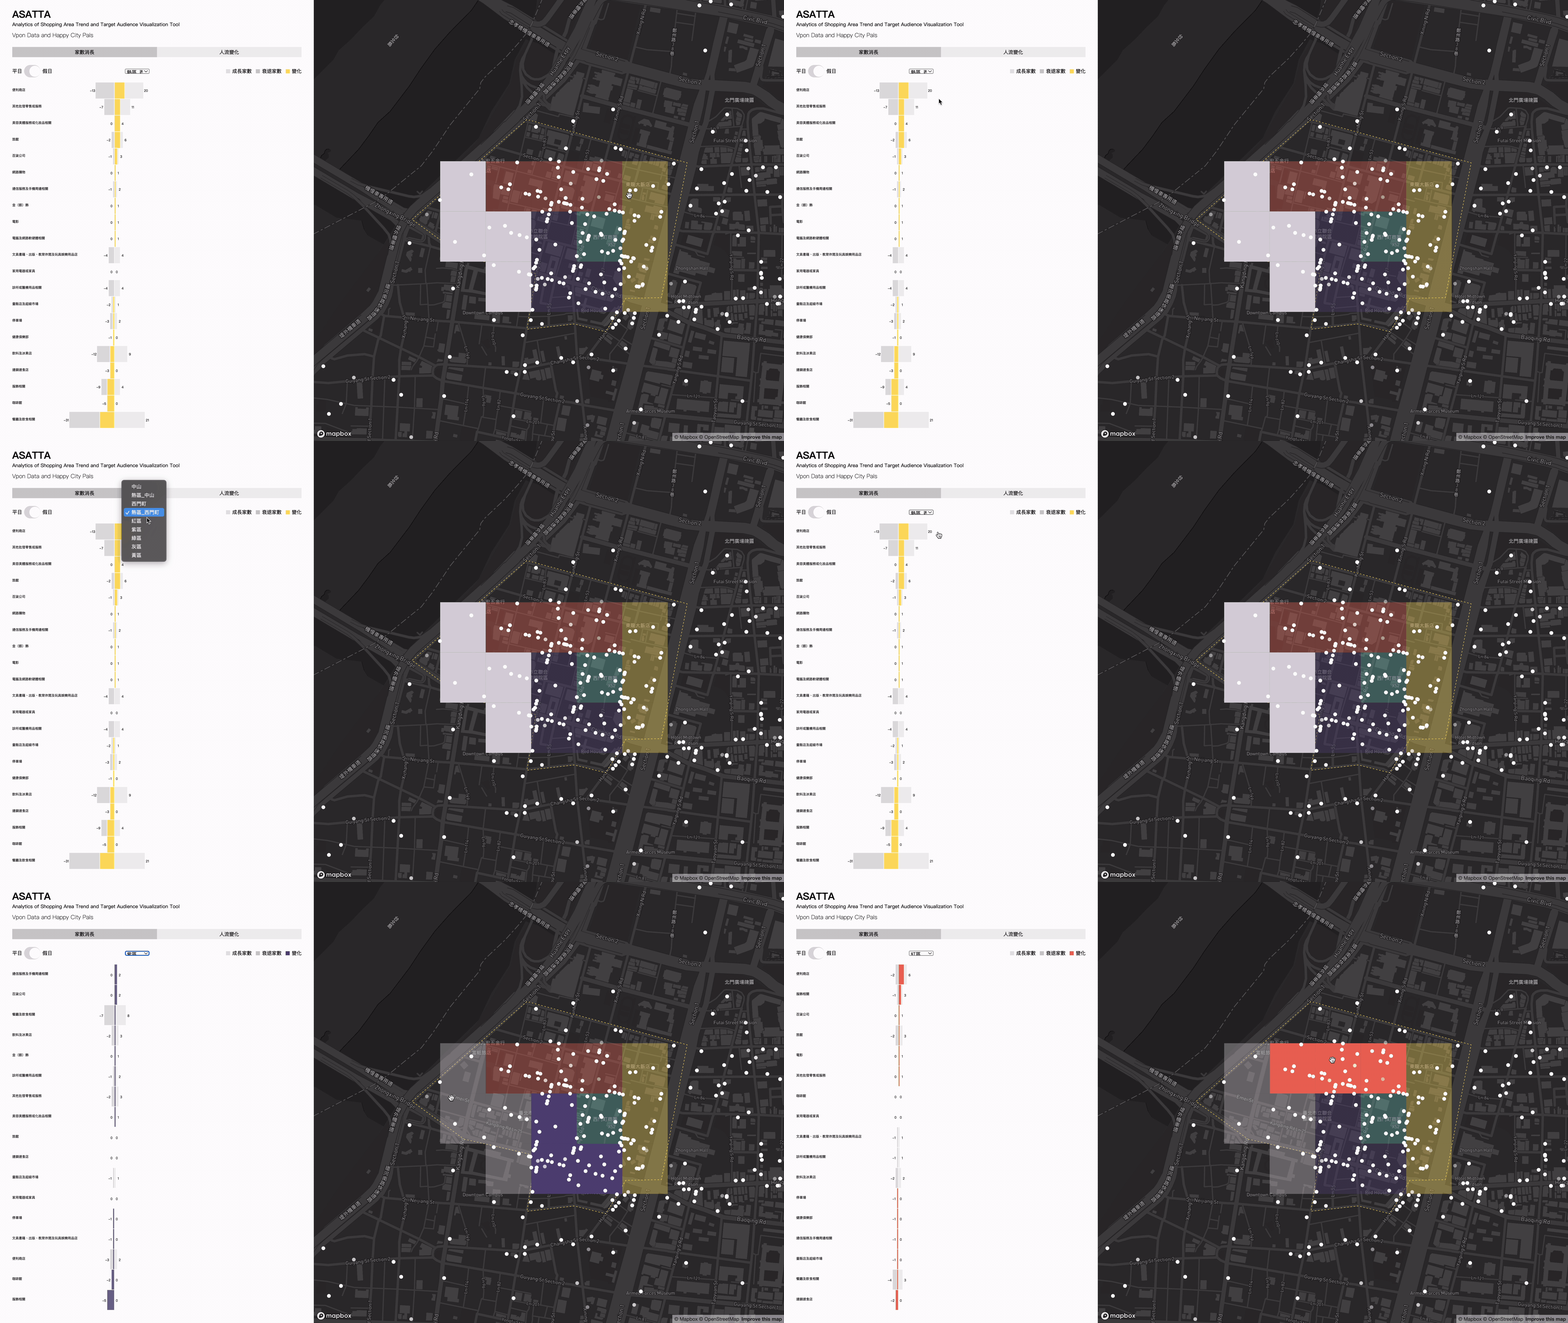
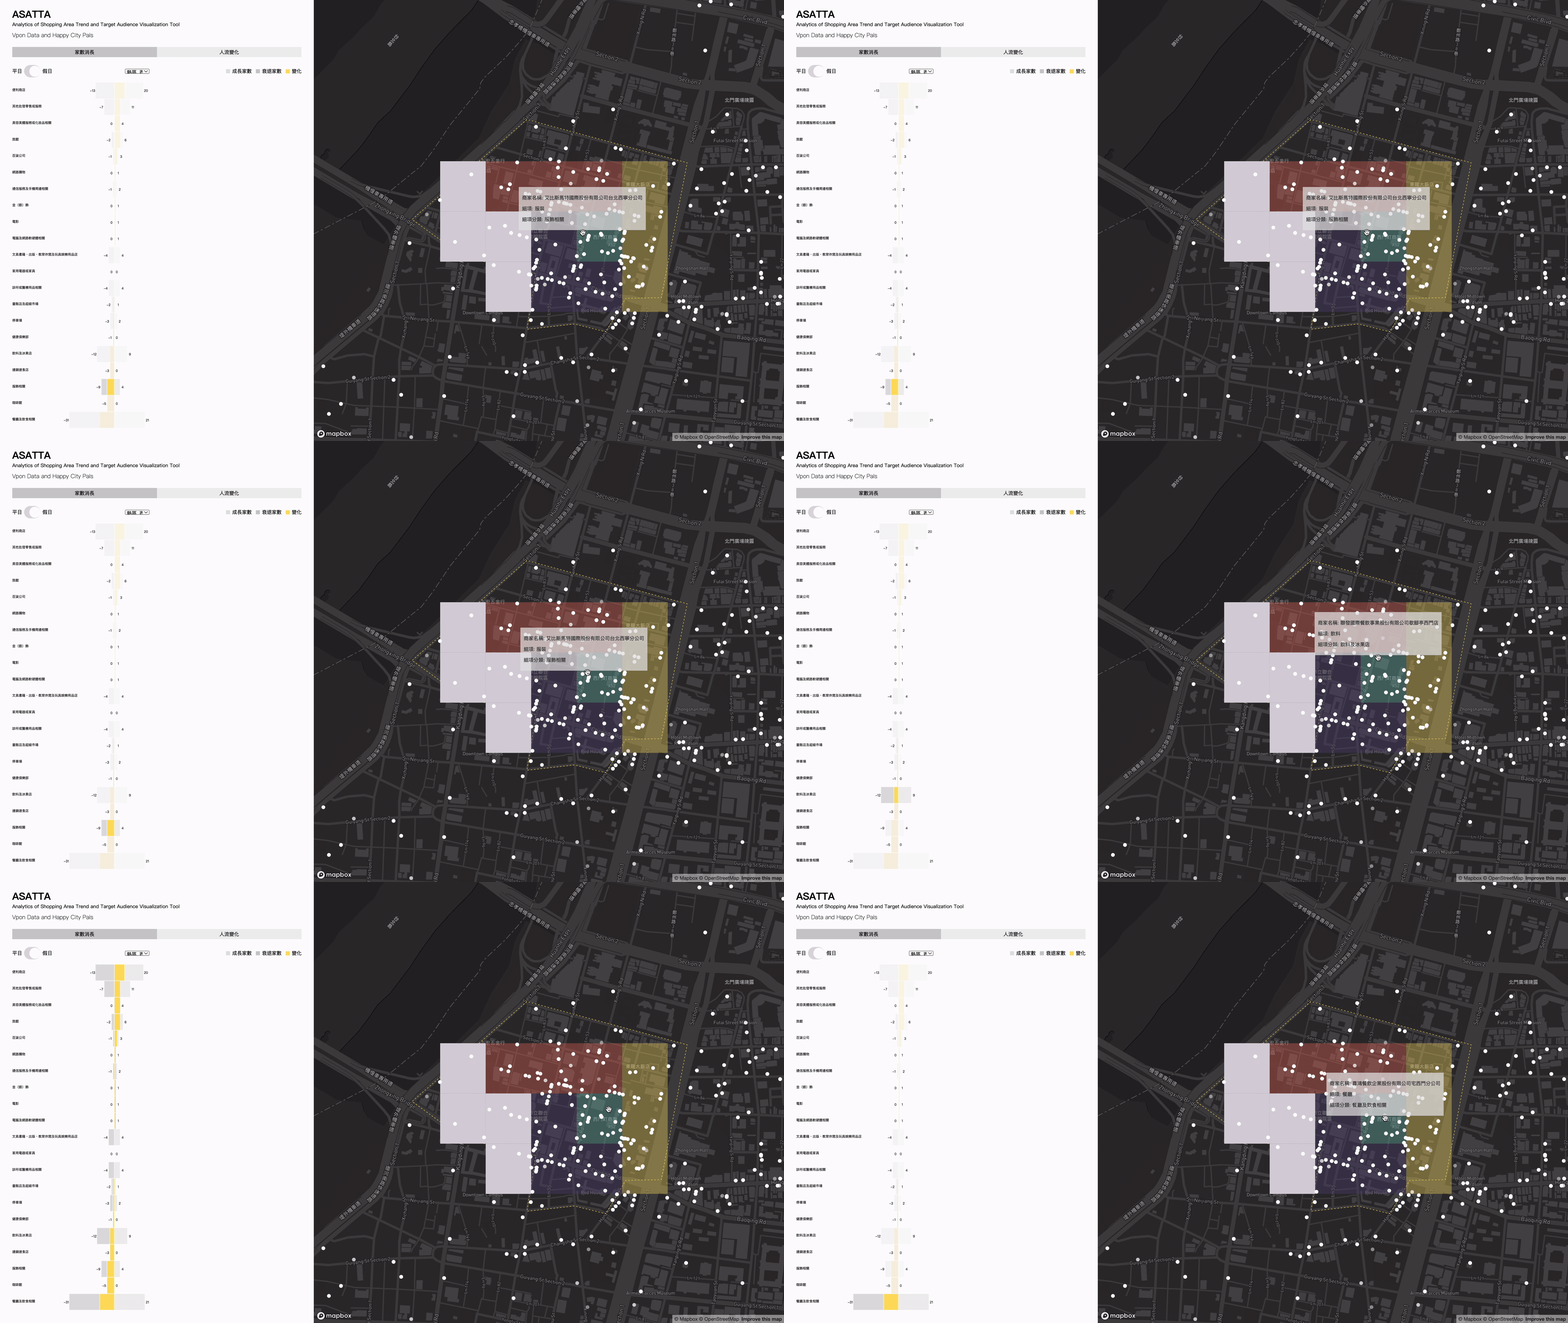
COVID-19 has seriously impacted the Ximen shopping district. To help the district weather the storm, the team built up the solution by clarifying the current situation and developing the mapping visualization and commercial strategy suggestion. Based on the data of open resources, geography POI, and data from mobile devices, we built the interactive mapping website as an analytic tool for communicating with the public and commercial groups. Hoping this tool could assist the district or community to develop a more precise marketing plan in order to have a more thorough preparation in the post-pandemic era.
2022
Data Visualization
Hao Che Hung, Project Lead, Researcher
Yu Ming Wu, Researcher, Editing
Hao Lun Hung, Visualization Design, Visualization Development
Data Visualization
Hao Che Hung, Project Lead, Researcher
Yu Ming Wu, Researcher, Editing
Hao Lun Hung, Visualization Design, Visualization Development

